VTable 使用问题:如何在表格中插入迷你图?
问题描述
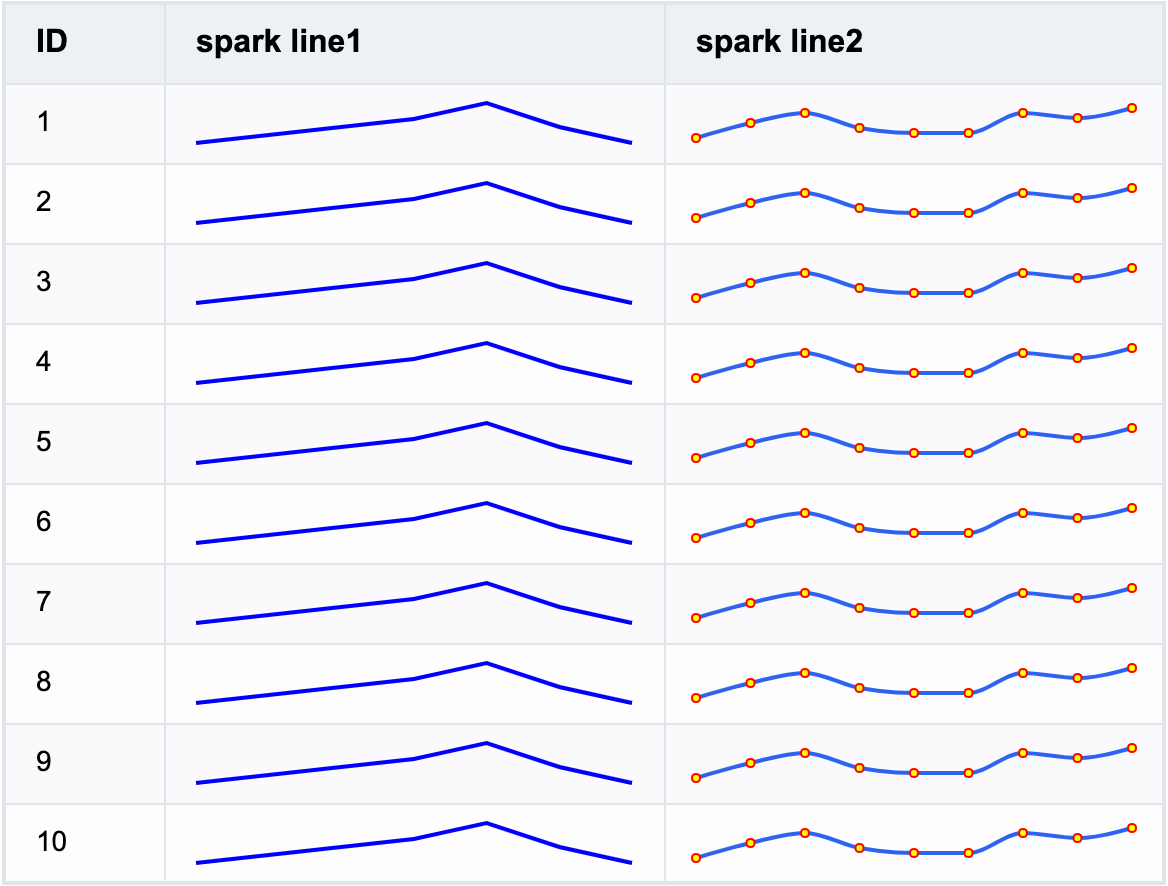
表格中一列中单元格内需要展示反映一组数据动态的迷你折线图,如何在 VTable 中实现这个效果?
解决方案
在 VTable 中,可以通过在 columns 中将 cellType 设置为 sparkline,指定该列为 sparkline 类型单元格。
- 迷你图数据
sparkline类型单元格所指定的数据可以是一组数字组成的数组(数字会默认为迷你图中的 y,x 会按照顺序自动填充),也可以是一组 x,y 对象组成的数组:
// ......
{
  lineData1: [10, 20, 30, 40, 60, 30, 10],
  lineData2: [
    { x: 0, y: 10 },
    { x: 1, y: 40 },
    { x: 2, y: 60 },
    { x: 3, y: 30 },
    { x: 4, y: 20 },
    { x: 5, y: 20 },
    { x: 6, y: 60 },
    { x: 7, y: 50 },
    { x: 8, y: 70 }
  ]
}
- 迷你图样式
columns中,除了配置cellType为sparkline,还可以通过sparklineSpec配置迷你图样式 spec(不配置使用默认样式),spec 规则参考 VChart:
const baseSpec: TYPES.SparklineSpec = {
  type: 'line',
  xField: {
    field: 'x',
    domain: [0, 1, 2, 3, 4, 5, 6, 7, 8]
  },
  yField: {
    field: 'y',
    domain: [0, 80]
  },
  smooth: true,
  pointShowRule: 'all',
  line: {
    style: {
      stroke: '#2E62F1',
      strokeWidth: 2
    }
  },
  point: {
    hover: {
      stroke: 'blue',
      strokeWidth: 1,
      fill: 'red',
      shape: 'circle',
      size: 4
    },
    style: {
      stroke: 'red',
      strokeWidth: 1,
      fill: 'yellow',
      shape: 'circle',
      size: 2
    }
  },
  crosshair: {
    style: {
      stroke: 'gray',
      strokeWidth: 1
    }
  }
};

// option: ......
columns: [
  {
    field: 'lineData2',
    title: 'spark line2',
    cellType: 'sparkline',
    width: 250,
    sparklineSpec: baseSpec
  }
];
其中:
- type: 迷你图的类型,目前仅支持 line
- xField: x 轴维度信息,配置 x 轴映射的数据字段、x 轴数据范围等
- yField: y 轴维度信息,配置 y 轴映射的数据字段、y 轴数据范围等
- smooth: 折线是否平滑显示
- pointShowRule: 折点的显示规则,支持以下配置:
- all: 显示所有点
- none: 不显示点
- isolatedPoint: 表示只显示孤立点(即前后值为空)
- line: 折线的样式
- point: 折点的样式
- crosshair: 交互显示的十字线样式
代码示例
const baseSpec: TYPES.SparklineSpec = {
  type: 'line',
  xField: {
    field: 'x',
    domain: [0, 1, 2, 3, 4, 5, 6, 7, 8]
  },
  yField: {
    field: 'y',
    domain: [0, 80]
  },
  smooth: true,
  pointShowRule: 'all',
  line: {
    style: {
      stroke: '#2E62F1',
      strokeWidth: 2
    }
  },
  point: {
    hover: {
      stroke: 'blue',
      strokeWidth: 1,
      fill: 'red',
      shape: 'circle',
      size: 4
    },
    style: {
      stroke: 'red',
      strokeWidth: 1,
      fill: 'yellow',
      shape: 'circle',
      size: 2
    }
  },
  crosshair: {
    style: {
      stroke: 'gray',
      strokeWidth: 1
    }
  }
};

const records = generateRecords(10);

const columns = [
  {
    field: 'id',
    title: 'ID',
    width: 80
  },
  {
    field: 'lineData1',
    title: 'spark line1',
    cellType: 'sparkline',
    width: 250
  },
  {
    field: 'lineData2',
    title: 'spark line2',
    cellType: 'sparkline',
    width: 250,
    sparklineSpec: baseSpec
  }
];
const option: TYPES.ListTableConstructorOptions = {
  records,
  columns
};
结果展示